What Should Be in a Network Diagram for Security Audits?
A network diagram is not a decorative picture for a policy folder. For a security audit, it should help someone understand what is connected, how traffic moves, where trust boundaries sit and what could fail. It should also be accurate enough to guide an investigation at 2am, when a link is down, an alert is firing and nobody can remember which patch-panel port feeds the switch.
That means showing more than routers and a cloud symbol. Physical infrastructure is part of cybersecurity, not a separate facilities concern. Cables, patch panels, switches, power supplies and device placement determine whether intended security controls work—and whether defenders can see what is happening.
A useful set of network diagrams gives auditors a clear view of the environment and gives engineers a practical reference for change and incident response. It should be supported by an asset inventory, kept current, and detailed enough to show how segmentation is implemented in reality.
Start with purpose, scope and ownership
Before drawing, state what the diagram covers. Is it the whole organisation, a site, a data centre, a production line or a particular service? Include the locations and environments in scope, the date last verified, the document owner and a version number. A diagram without a defined scope can look comprehensive while quietly excluding a structured cabling remote site, a supplier link or an ageing OT network.
Security audits often benefit from more than one view. A single page that tries to show every cable, route, rule and endpoint quickly becomes unreadable. Build a small, related set of diagrams instead:
- Context diagram: sites, cloud environments, major services, external connections and trust boundaries.
- Logical diagram: VLANs, subnets, routing, security zones and permitted traffic paths.
- Physical diagram: equipment, racks, patch panels, cabling paths, switch ports and resilient links where relevant.
- Data-flow or service diagram: important applications, their dependencies and the protocols or flows they require.
These views should agree with each other. If a logical diagram says an OT zone is isolated, the physical and routing views should help an auditor verify how that isolation is achieved.
Show the physical infrastructure, not just the logical design
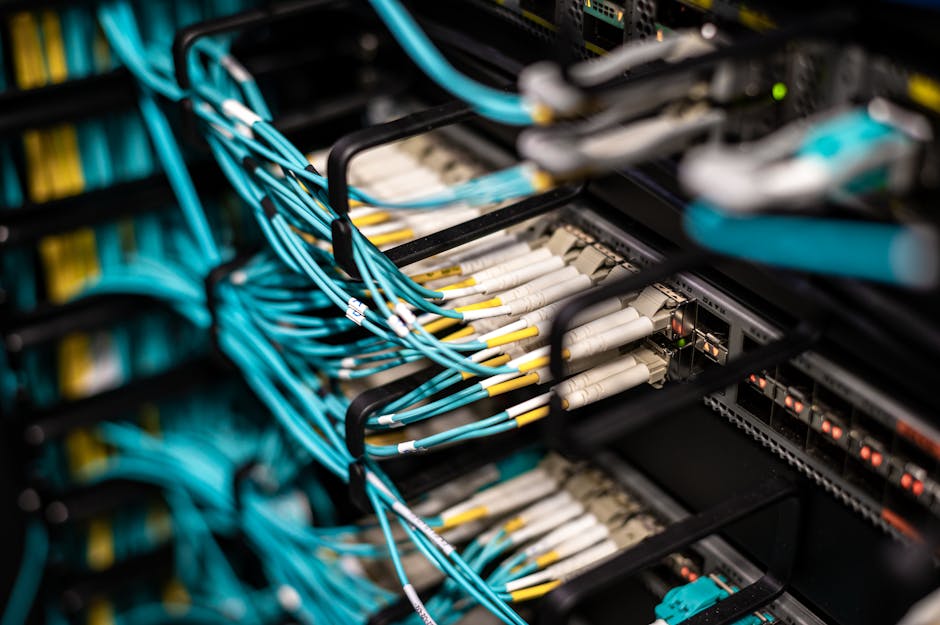
Physical infrastructure is part of the security boundary. The diagram should identify the main network equipment and how it connects: routers, firewalls, switches, wireless access points, network cabinets, patch panels and important links between them. For larger or higher-risk sites, include device names, locations, rack or cabinet references and interface or port identifiers where they help someone trace a connection.
It is rarely necessary to draw every office wall socket on a high-level diagram. But the physical view should make critical pathways and dependencies findable. If a production controller depends on a particular switch, or a security appliance is connected through an intermediate device, that relationship matters.
- Identify the location of core, distribution and access switching.
- Show uplinks, redundant paths and single points of failure.
- Mark links between security zones, including which device controls or inspects the traffic.
- Record relevant power, cabinet or environmental dependencies for critical equipment.
- Use consistent labels that match the equipment, patch panels and asset inventory.
Unlabelled patch panels and unexplained links are not minor housekeeping issues. They make it harder to verify the intended design, isolate faults and establish whether an unknown device has been connected. I keep a label maker in my laptop bag for a reason. Mystery cables are a security smell: they can conceal an undocumented bridge between networks, or simply make an outage take much longer to diagnose.
Physical faults can become security blind spots
A bad cable or misconfigured switch port can cause an outage, but the security impact can be less obvious. A monitoring sensor may lose its feed. A redundant link may fail silently until the primary path is also disrupted. A device may be moved to a port in the wrong VLAN. A temporary unmanaged switch can join systems that were meant to be separated.
Network diagrams should therefore show the points on which visibility and control depend. If traffic monitoring uses a network TAP or a switch mirror port, identify the source link, the monitoring connection and the destination platform. For example, Garland network TAPs may appear in a design where traffic is copied to monitoring or security tools. The diagram should make clear what traffic is available to inspect and what is not; a sensor cannot detect traffic it never receives.
Make segmentation visible and verifiable
A segmentation map should show the security zones that matter to the organisation, not merely list VLAN numbers. Typical zones include user endpoints, servers, management interfaces, guest wireless, internet-facing services, backup infrastructure, building systems and OT. The right boundaries depend on the business and the consequences of compromise.
For each zone, show its name, purpose, associated VLAN or network, address range where appropriate, and the controls governing traffic in and out. Mark routing points and policy enforcement devices. If communications are allowed between zones, describe the purpose and direction. A rule such as “users to servers” is not useful enough for an audit; identify the relevant service or application and whether the connection is initiated from one side or both.
Diagram element What to record Why an auditor cares Security zone Name, purpose, VLAN or subnet, and owner Shows whether assets are grouped according to risk and function Inter-zone connection Source, destination, protocol or service, direction, enforcement point Helps verify that access is intentional and controlled Switching infrastructure Device, management location, uplinks and relevant port or trunk details Shows whether the design can implement and maintain the intended separation External connection Provider or partner, termination point, route and security controls Highlights exposure and third-party dependenciesSegmentation depends on capable switching and correct design. A diagram that depicts separate zones does not prove that they are separated. Verify the switch capabilities, VLAN configuration, trunking, routing and access controls against the live environment. Unmanaged switches in production are particularly concerning: they can undermine the documented design, obscure what is connected and complicate troubleshooting. The map should identify any such devices, their purpose and the remediation plan—not quietly omit them.
Include assets, services and security controls
A diagram should be connected to a reliable asset inventory, not treated as a replacement for one. The asset inventory can hold detailed records such as serial numbers, firmware versions, owners, criticality and support status. The diagram helps people see relationships and paths; the inventory helps them identify and manage each asset. Both should use consistent names or identifiers.
Include assets that affect security boundaries or important services: firewalls, routers, switches, wireless controllers, servers, industrial controllers, remote-access gateways, monitoring sensors and other network-connected equipment. Show security controls where they operate. For instance, mark firewalls at internet and inter-zone boundaries and indicate where endpoint detection platforms collect telemetry or where management traffic reaches endpoint systems.
Do not overload the diagram with every product setting. Instead, show the control point and link to the supporting evidence: firewall rule sets, switch configuration backups, endpoint management records or monitoring coverage reports. This keeps the picture readable while making audit verification practical.
For OT environments, include the boundary between corporate IT and operational systems, remote access paths, engineering workstations, supervisory systems and critical controllers. Identify any conduits or gateways that carry traffic between zones. Equipment from vendors such as MOXA may be used in industrial networking; show where it sits, what it connects and which zone it belongs to. A vendor name alone is not a security control: firmware, management access, configuration and support arrangements still need to be assessed.
Show outside connections and essential data flows
Many gaps sit at the edges of a network: supplier connections, cloud services, mobile access, VPNs, partner links, internet-facing applications and temporary support pathways. Include these even if another party operates the service. Identify who owns the connection, where it terminates, what it can reach and how it is monitored.
For important business services, show the main data flows and dependencies. An application may rely on DNS, identity services, time synchronisation, database servers, backup systems or cloud APIs. These dependencies affect both resilience and security. If a firewall rule is being reviewed, or an incident team needs to understand the likely reach of a compromised host, a meaningful flow view is more useful than a row of generic server icons.
Use arrows consistently and label important protocols or services where known. Distinguish normal production traffic from management, backup and monitoring traffic. Avoid drawing every possible flow on the same page; prioritise critical services and high-risk boundaries, then link to detailed records.
Use the diagram to support audit evidence
ACSC guidance and security practices assume solid network foundations: assets are known, boundaries are understood, access is controlled, and systems can be managed and monitored. A diagram will not, by itself, demonstrate compliance or prove that a control is effective. It can, however, help an auditor test whether documented security arrangements match the infrastructure in use.
Prepare to validate the diagram against evidence such as configuration exports, firewall policies, switch and router records, cloud network settings, physical inspections and asset-management data. Where appropriate, compare the design with monitoring output and the observed devices on the network. Record gaps rather than making the drawing appear cleaner than reality.
Mark the diagram’s classification and handle it accordingly. Detailed diagrams may expose device names, network ranges, security boundaries and management paths. Store them in a controlled location, restrict access to those who need it, and avoid circulating sensitive versions unnecessarily.
Keep it current and useful at 2am
A network diagram becomes unreliable when changes happen faster than updates. Make diagram updates part of change management: changes to switches, firewall boundaries, routing, cloud connectivity or site cabling should trigger review of the relevant view. Assign an owner and set a review frequency based on how quickly the environment changes and how critical it is.

Use a simple validation process:
- Compare device names and locations with the asset inventory.
- Check logical boundaries against current switch, routing and firewall configurations.
- Trace critical physical links, including redundant paths and monitoring connections.
- Confirm that remote, supplier, cloud and OT connections are represented.
- Ask system and network owners to review their services and dependencies.
- Record unresolved discrepancies, owners and target dates.
Good network diagrams are not judged by how polished they look. They are judged by whether they help people understand, test and operate the network safely. A clear context view, a trustworthy segmentation map, a traceable physical design and a current asset inventory give auditors a much stronger basis for their work—and give responders a better chance of finding the fault or containing the incident before a small problem becomes a long night.